
Intro
Unlock the power of data analysis with our in-depth guide to Descriptive vs Inferential Statistics. Learn the key differences between descriptive statistics, which summarize data, and inferential statistics, which make predictions and inferences. Discover how to apply statistical methods, such as hypothesis testing and confidence intervals, to make data-driven decisions.
Understanding the difference between descriptive and inferential statistics is crucial for making informed decisions in various fields, including business, healthcare, and social sciences. Statistics play a vital role in data analysis, and the two primary branches of statistics are descriptive and inferential. While they are interconnected, they serve distinct purposes and are used in different contexts.
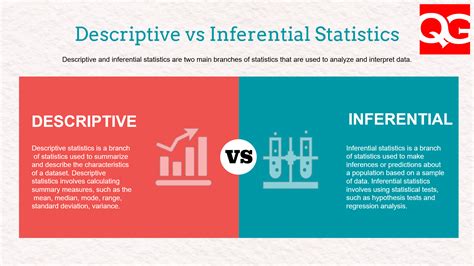
Descriptive statistics is concerned with summarizing and describing the main features of a dataset. It involves calculating various measures, such as mean, median, mode, and standard deviation, to provide an overview of the data. This branch of statistics helps to identify patterns, trends, and correlations within the data, making it easier to understand and visualize.
On the other hand, inferential statistics involves making conclusions or inferences about a population based on a sample of data. It relies on probability theory and statistical tests to determine whether the findings from a sample can be generalized to the larger population. Inferential statistics is used to test hypotheses, estimate population parameters, and make predictions about future events.
In this article, we will delve deeper into the world of descriptive and inferential statistics, exploring their definitions, applications, and key differences.
Descriptive Statistics: A Closer Look
Descriptive statistics provides a snapshot of the data, highlighting its central tendency, dispersion, and shape. The primary goal is to summarize the data in a way that is easy to understand and communicate. Common measures used in descriptive statistics include:
- Mean: The average value of the data
- Median: The middle value of the data when it is sorted in ascending order
- Mode: The most frequently occurring value in the data
- Standard Deviation: A measure of the spread or dispersion of the data
- Variance: The average of the squared differences from the mean
Descriptive statistics is essential in various fields, such as:
- Business: To analyze customer demographics, sales trends, and market research
- Healthcare: To track patient outcomes, disease prevalence, and treatment efficacy
- Social Sciences: To study population trends, economic indicators, and social behaviors
Inferential Statistics: Making Inferences
Inferential statistics involves using sample data to make inferences about a population. This branch of statistics relies on probability theory and statistical tests to determine whether the findings from a sample can be generalized to the larger population. The primary goals of inferential statistics are:
- Hypothesis Testing: To test a hypothesis about a population parameter
- Estimation: To estimate a population parameter based on sample data
- Prediction: To predict future events or outcomes based on past data
Inferential statistics is widely used in:
- Medicine: To test the efficacy of new treatments or medications
- Marketing: To predict customer behavior and preferences
- Finance: To forecast stock prices and market trends
Key Differences Between Descriptive and Inferential Statistics
| Descriptive Statistics | Inferential Statistics | |
|---|---|---|
| Purpose | Summarize and describe data | Make inferences about a population |
| Focus | Sample data | Population parameters |
| Measures | Mean, Median, Mode, Standard Deviation | Hypothesis testing, estimation, prediction |
| Goal | Understand data characteristics | Generalize findings to a population |
When to Use Descriptive Statistics
Descriptive statistics is useful when:
- You want to summarize and describe a dataset
- You need to identify patterns, trends, and correlations
- You want to communicate complex data insights to stakeholders
When to Use Inferential Statistics
Inferential statistics is useful when:
- You want to make conclusions about a population based on a sample
- You need to test a hypothesis or estimate a population parameter
- You want to predict future events or outcomes
Common Applications of Descriptive and Inferential Statistics
Both descriptive and inferential statistics have numerous applications in various fields. Here are a few examples:
- Business Intelligence: Descriptive statistics is used to analyze customer behavior, while inferential statistics is used to predict sales trends and forecast revenue.
- Medical Research: Descriptive statistics is used to summarize patient outcomes, while inferential statistics is used to test the efficacy of new treatments.
- Social Sciences: Descriptive statistics is used to study population trends, while inferential statistics is used to estimate the impact of social programs on outcomes.
Best Practices for Using Descriptive and Inferential Statistics
To get the most out of descriptive and inferential statistics, follow these best practices:
- Use descriptive statistics to summarize data: Before making inferences, use descriptive statistics to understand the data characteristics.
- Choose the right statistical test: Select the appropriate statistical test based on the research question and data type.
- Interpret results correctly: Avoid misinterpreting results by understanding the limitations and assumptions of each statistical test.
Common Mistakes to Avoid
When using descriptive and inferential statistics, avoid the following common mistakes:
- Misinterpreting descriptive statistics: Descriptive statistics only provides a snapshot of the data and should not be used to make inferences about a population.
- Using the wrong statistical test: Choose the right statistical test based on the research question and data type to avoid incorrect conclusions.
- Ignoring assumptions: Statistical tests rely on assumptions about the data. Ignoring these assumptions can lead to incorrect conclusions.
Conclusion
In conclusion, descriptive and inferential statistics are two interconnected branches of statistics that serve distinct purposes. Descriptive statistics provides a snapshot of the data, while inferential statistics makes inferences about a population based on a sample. By understanding the key differences between these two branches, you can use them effectively in various fields to make informed decisions.
FAQs
What is the main difference between descriptive and inferential statistics?
+The main difference between descriptive and inferential statistics is that descriptive statistics summarizes and describes the data, while inferential statistics makes inferences about a population based on a sample.
When should I use descriptive statistics?
+Use descriptive statistics when you want to summarize and describe a dataset, identify patterns, trends, and correlations, or communicate complex data insights to stakeholders.
What is the purpose of inferential statistics?
+The purpose of inferential statistics is to make inferences about a population based on a sample, test hypotheses, estimate population parameters, and predict future events or outcomes.
We hope this article has helped you understand the difference between descriptive and inferential statistics. If you have any further questions or would like to share your experiences with using these statistical branches, please leave a comment below.